Data cards
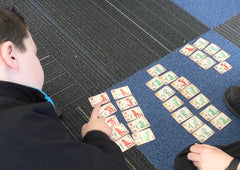 Data cards are a physical resource used by students to learn mathematics and statistics. For statistics data cards allow hands-on analysis, forming physical graphs and tables. They are a good way to introduce sampling.
For wider mathematics data cards allow a vast range of learning activities. They can build mathematical fluency through sorting, observing mathematical relationships and activities to build number sense.
Data cards are appropriate for a wide range of ages and mathematics concepts.
A data card
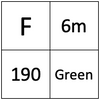
Each data card contains multivariate information for a different observation, individual or sampling unit. Each card provides information about the same attributes and measurements.
Card layout is consistent with information about the same attribute or measurement shown in the same way and in the same place on each card. Colours and visual effects can highlight different data values or provide this consistency. The data might be shown in a visual way, requiring the student to count, measure or observe data in an image.
Data cards can be made by the students, by the teacher or purchased as a teaching resource.
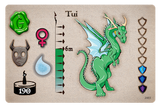
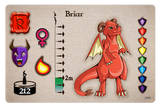
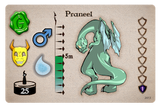
Below are three examples of data cards.
Dragonistics Dragon data cards
 |
 |
 |
Four-element data cards
 |
 |
 |
List-based data cards
 |
 |
 |
The data represented
The data represented by the data cards might be from a sample or population. This depends on the purpose, where the data is from and what it represents. The same data cards might be treated as a sample in one instance and as a population in another.
Teaching
At the earliest levels students learn about data and ways it can be manipulated to gain information from the data. Data cards hold multivariate data about individuals. A set of cards, together, holds information about a group. Sorting and organising a set of cards helps students learn the concepts of multivariate data and variability within data.
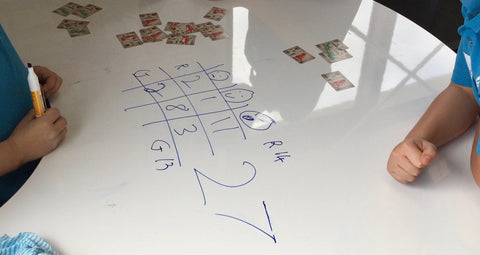
The data cards can be used to form physical tables and graphs. This physical activity helps students understand the relationship between individual data points and the data displays. This enables understanding of what the data displays represent. For example, each data card in a physical bar chart adds a fixed amount to the height of a bar.
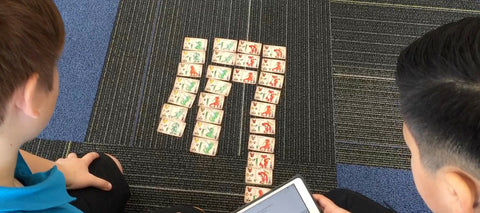
When different groups of students are given different sets of data cards to analyse in the classroom, each group will find different results based on their own set of cards. Students understand this intuitively, and it helps to develop the very important concept of variability between samples. The similarities between the results can help students see that samples can be used to infer properties of the population.
With enough data cards, maybe 500 or more, it is not practical to analyse all of the cards. Treating the cards as a population and analysing only a sample of the cards teaches concepts of sampling and inference. With such a 'large' population the need for sampling becomes obvious.
Data cards can also be used to teach a wider range of mathematical concepts and skills.
Dragonistics data cards are available from Creative Maths.
